
Tool · Updated monthly
Swiss Confederation bonds, FRP 4 and inflation: four-year projections
Every month we project the 10-year Swiss Confederation bond yield, the FRP 4 upper limit of the technical interest rate and Swiss inflation with a neural network autoregression (NNAR) model. The bands shown are statistical scenarios; they are not a forecast by allea.
Observed data to end of August 2026 · projection computed on 10 September 2026
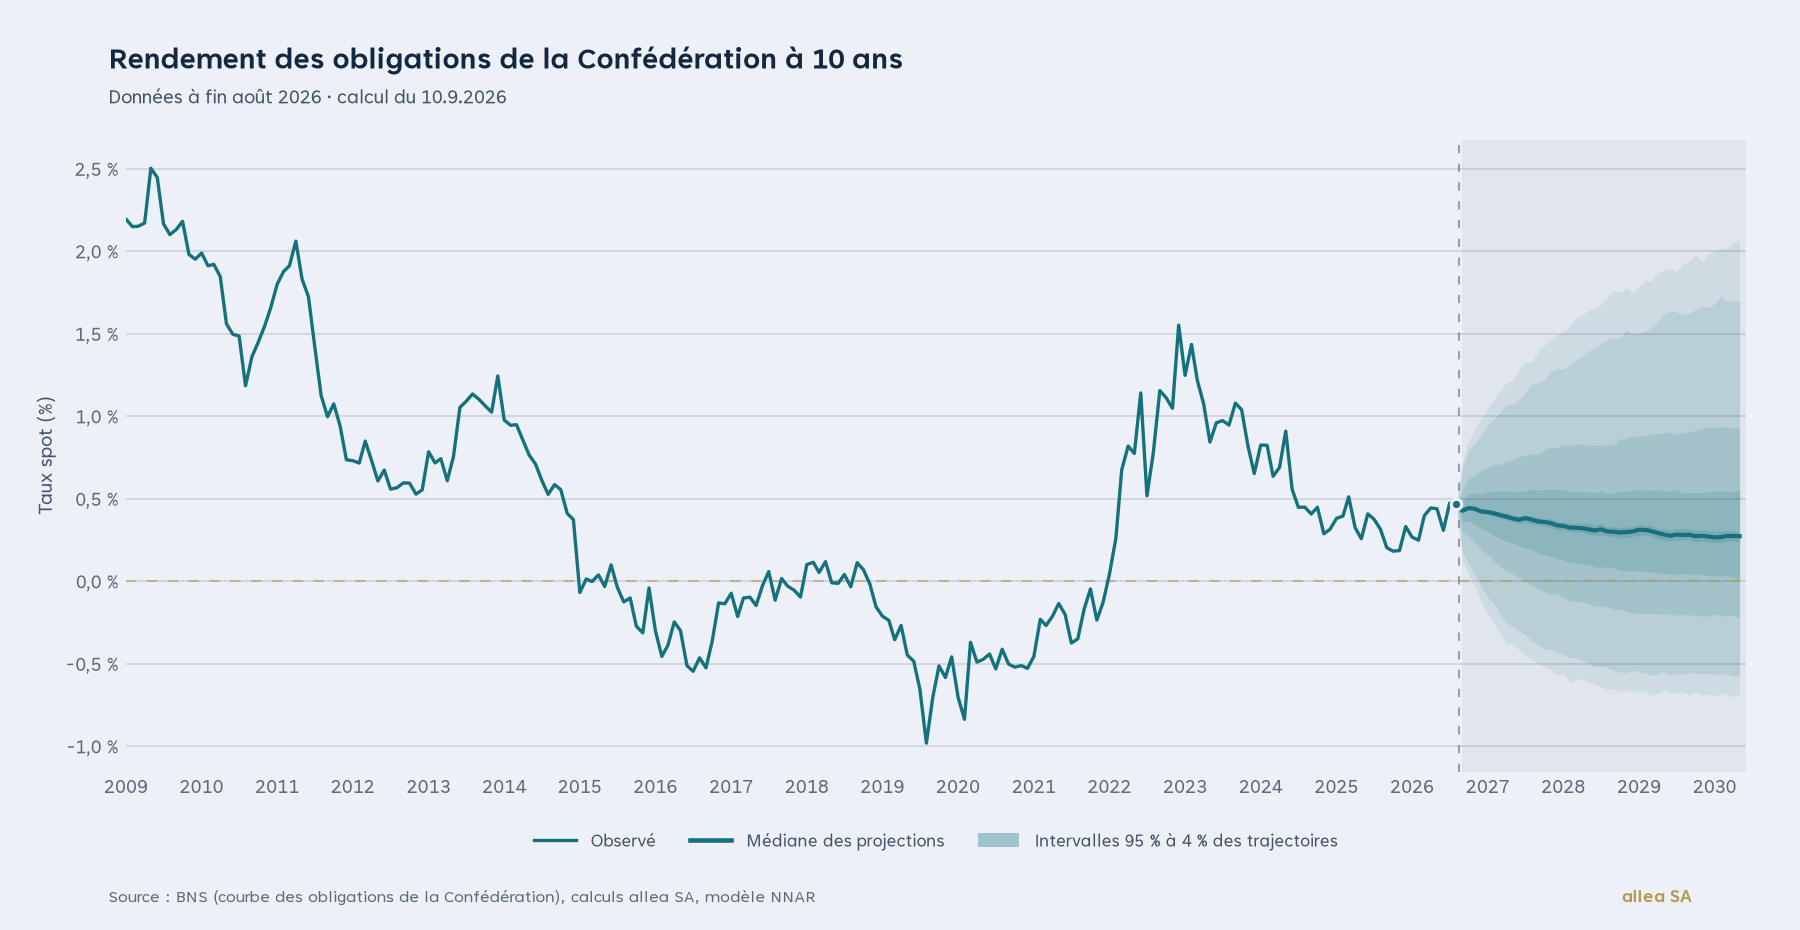
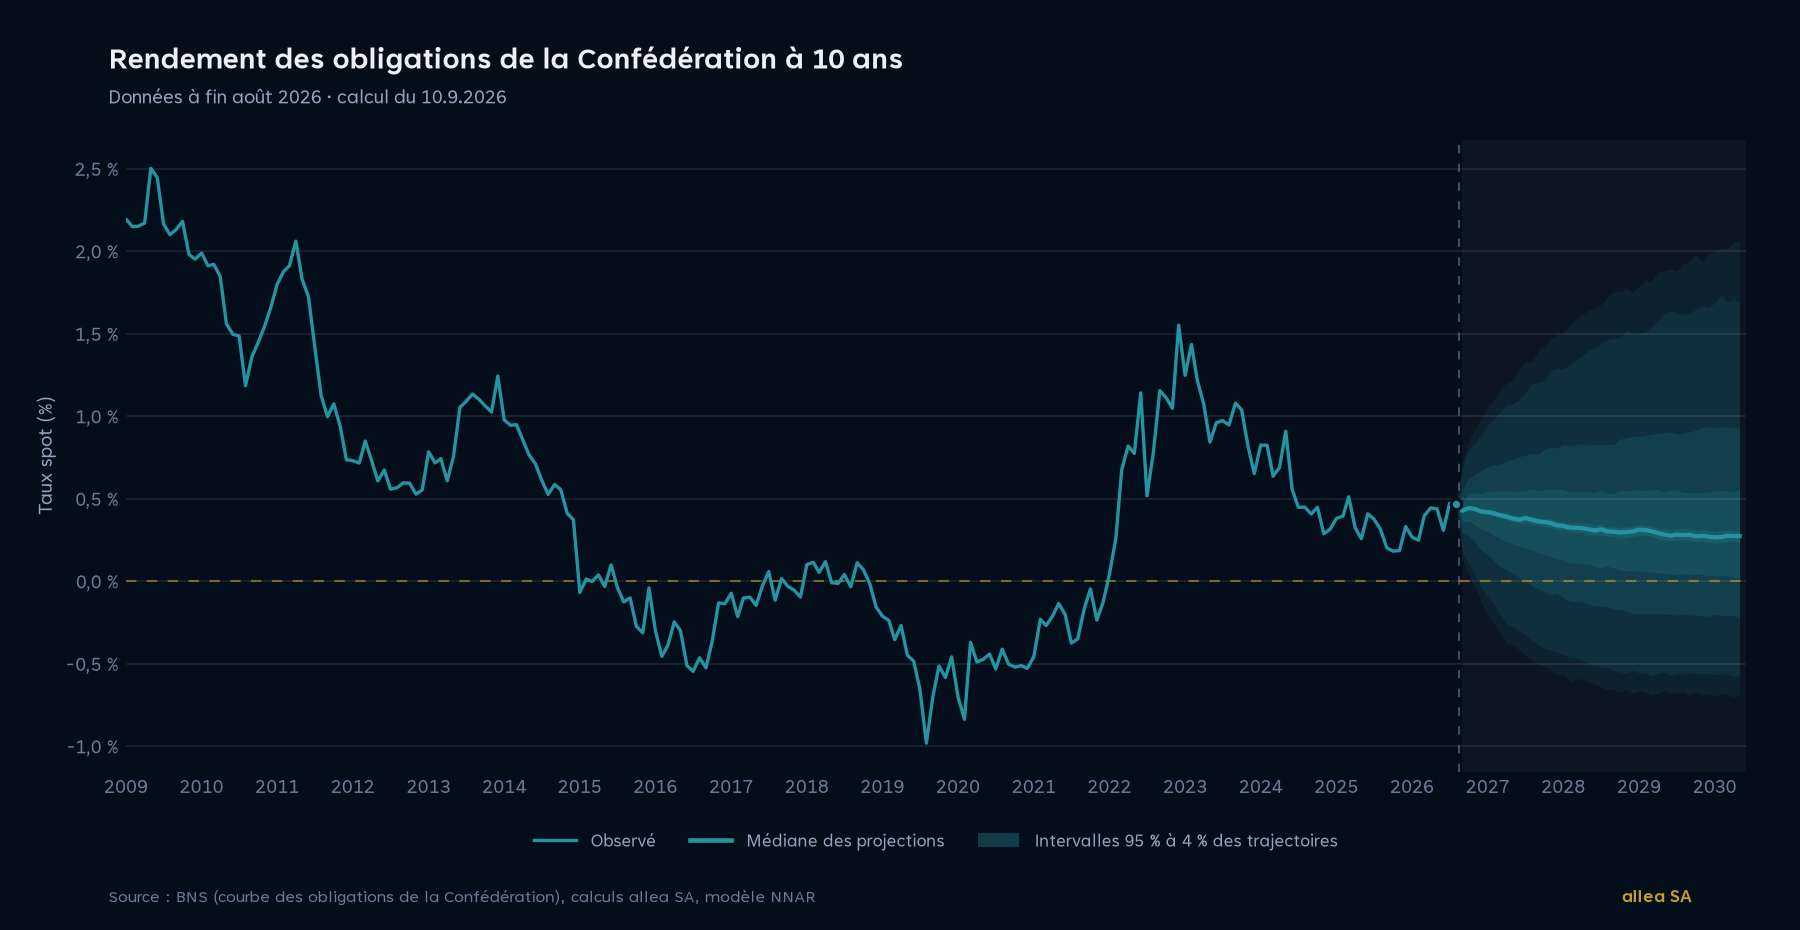
10-year spot rate of the Swiss Confederation bond curve (SNB, Nelson-Siegel-Svensson method), month-end. Bands: 95%, 90%, 60%, 30% and 4% intervals of the simulated paths; solid line: median.
| Horizon | 5% | Median | 95% |
|---|---|---|---|
| Last observed value (August 2026) | – | 0.47 | – |
| end of 2026 | -0.03 | 0.42 | 0.89 |
| end of 2027 | -0.43 | 0.34 | 1.29 |
| end of 2028 | -0.54 | 0.30 | 1.50 |
| end of 2029 | -0.56 | 0.27 | 1.66 |
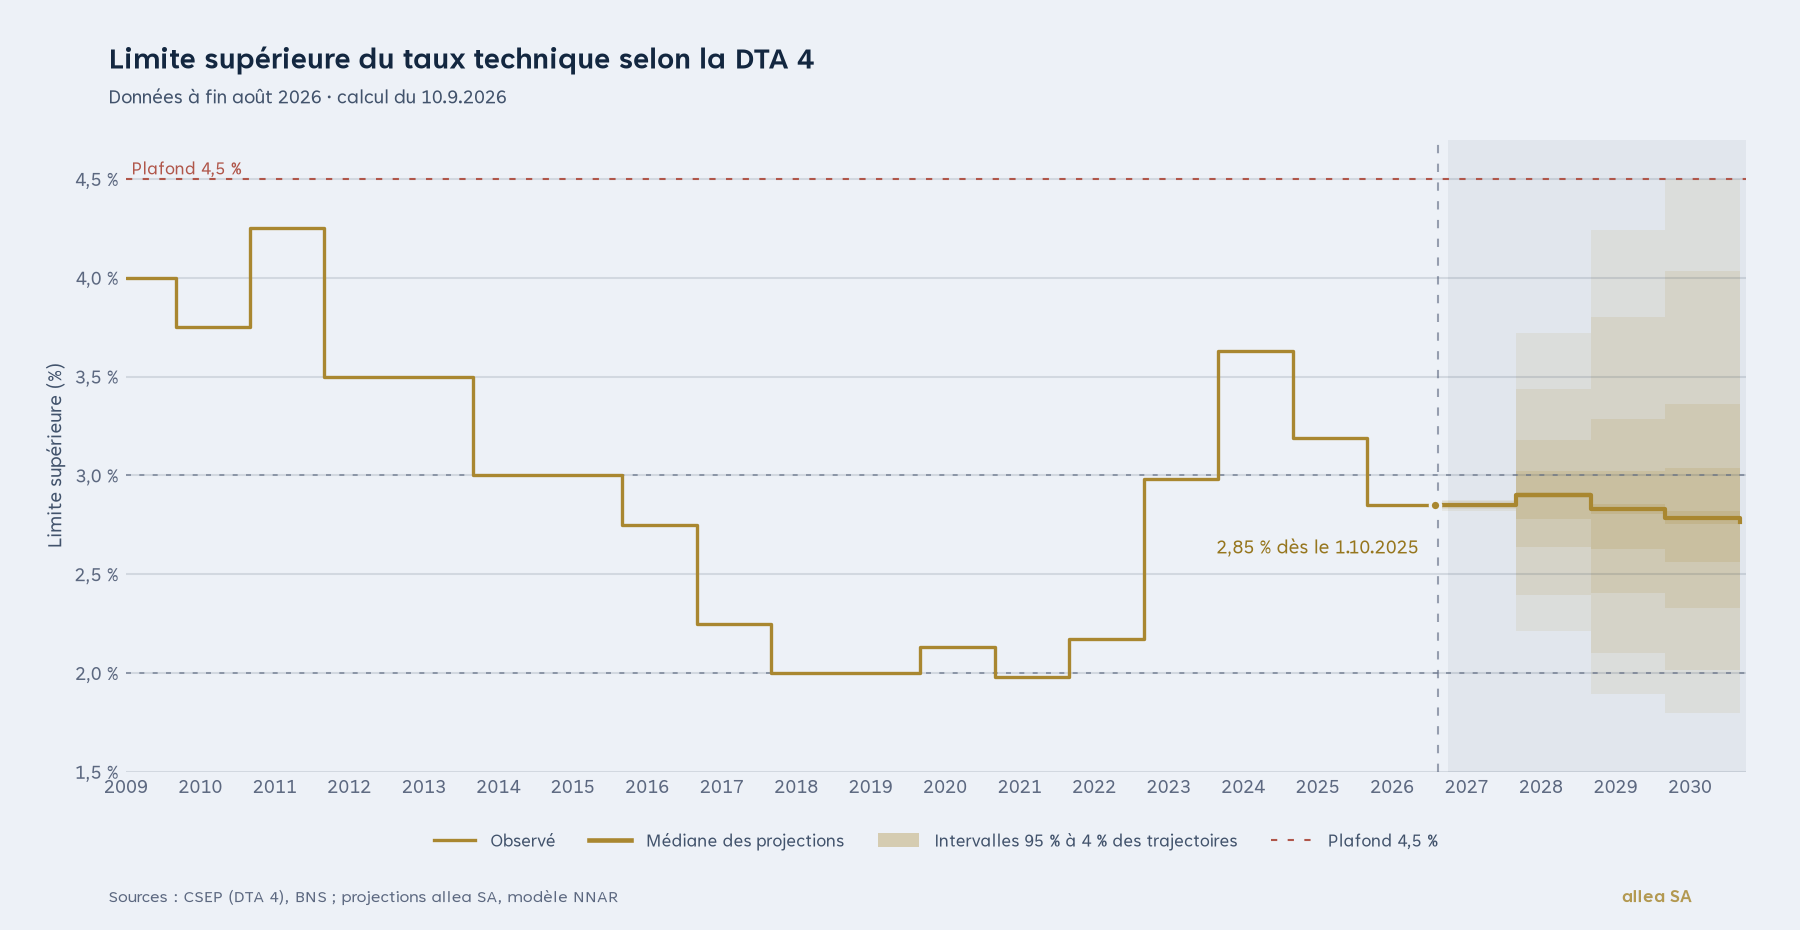
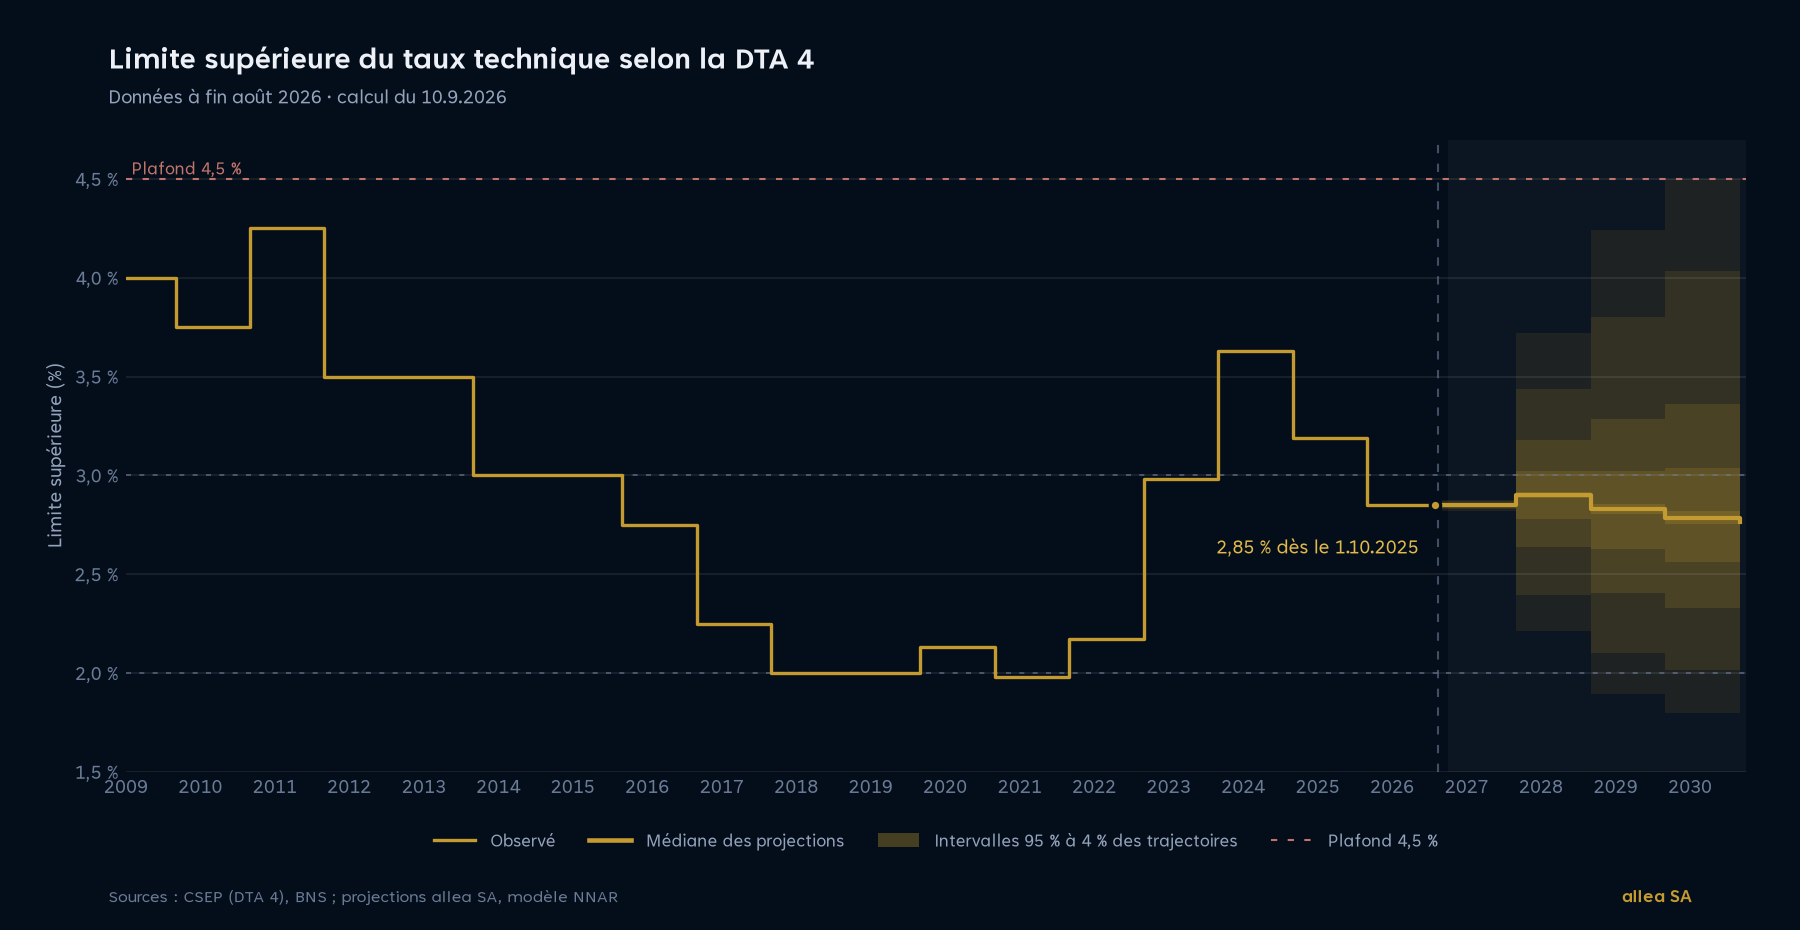
Set each 30 September by the Swiss Chamber of Pension Actuaries (SKPE), applicable from 1 October. Shaded zone: from the next reset.
How is the upper limit calculated?
Technical guideline 4 (FRP 4) of the Swiss Chamber of Pension Actuaries sets the upper limit of the technical interest rate at the average of the last twelve monthly 10-year Swiss Confederation spot rates plus 2.5 percentage points, for generational mortality tables. For period tables, 0.30 percentage points are deducted. The limit is capped at 4.5%. The value in force since 1 October 2025 is 2.85% (source: SKPE press release of 30 September 2025).
Because the formula depends only on the last twelve 10-year rates, the projection of the upper limit follows directly from the previous chart: each simulated path of the 10-year rate yields a path of the FRP 4 limit, whose quantiles we report at each 1 October.
| Horizon | 1% | 5% | Median | 95% | 99% |
|---|---|---|---|---|---|
| Last observed value (August 2026) | – | – | 2.85 | – | – |
| from 1 October 2026 | 2.82 | 2.83 | 2.85 | 2.87 | 2.88 |
| from 1 October 2027 | 2.21 | 2.39 | 2.90 | 3.44 | 3.72 |
| from 1 October 2028 | 1.89 | 2.10 | 2.83 | 3.80 | 4.24 |
| from 1 October 2029 | 1.80 | 2.01 | 2.79 | 4.03 | 4.50 |
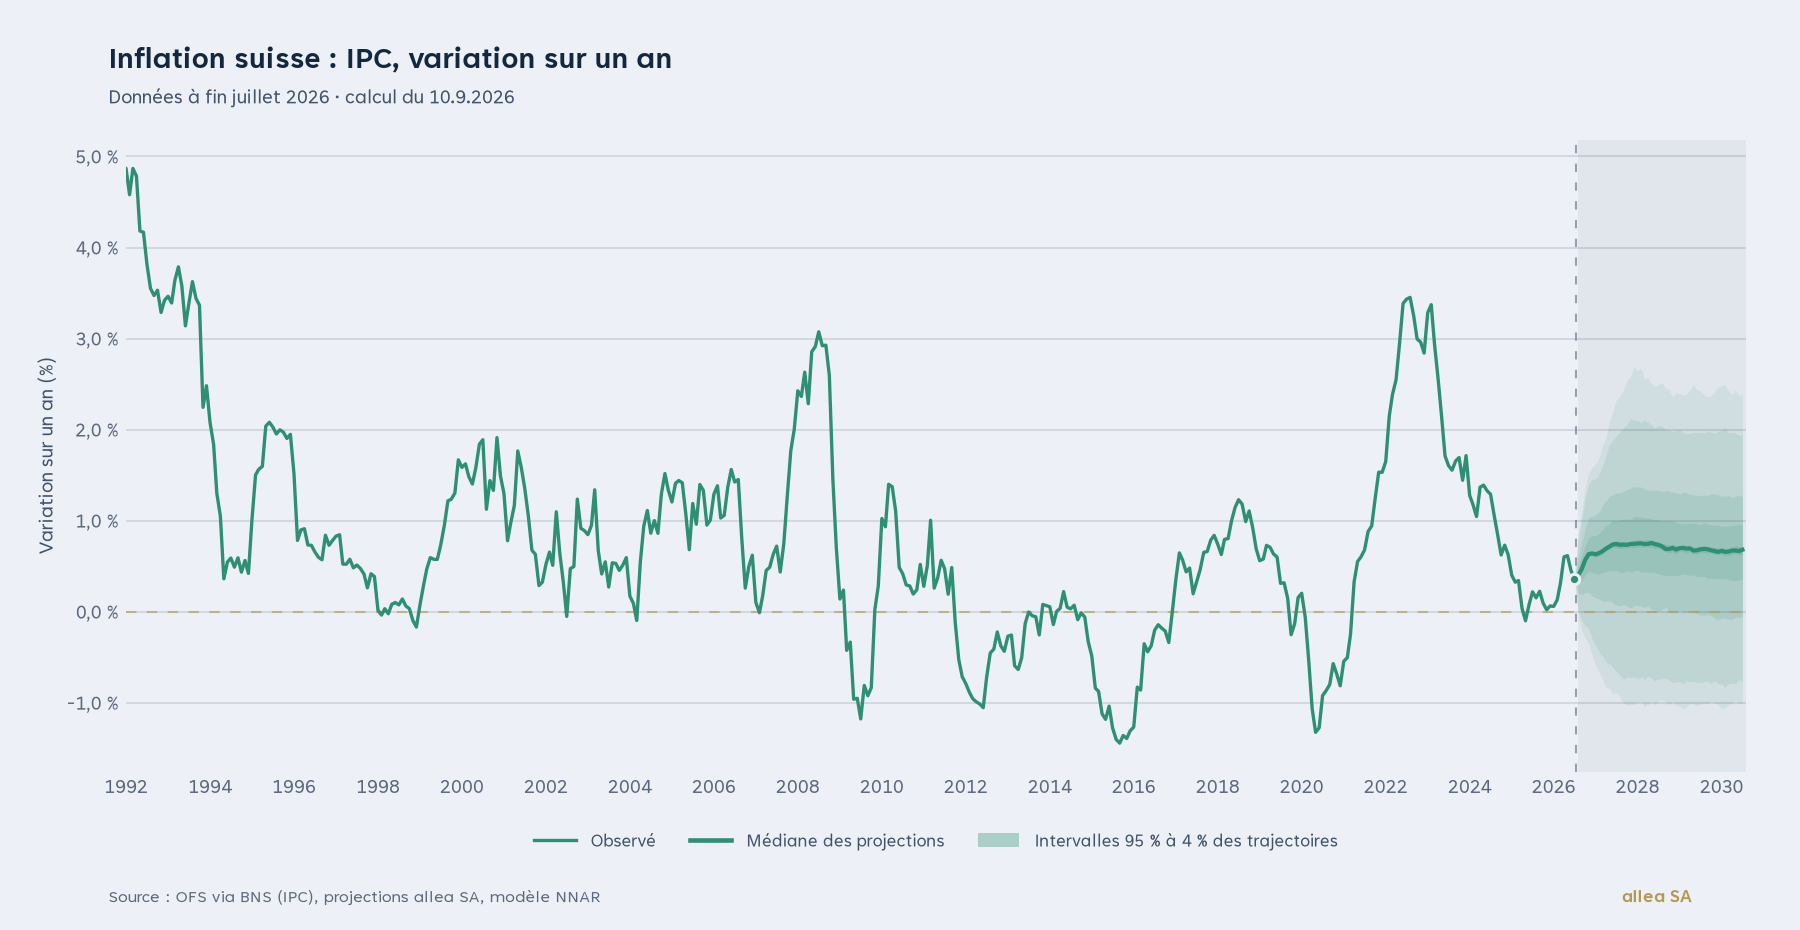
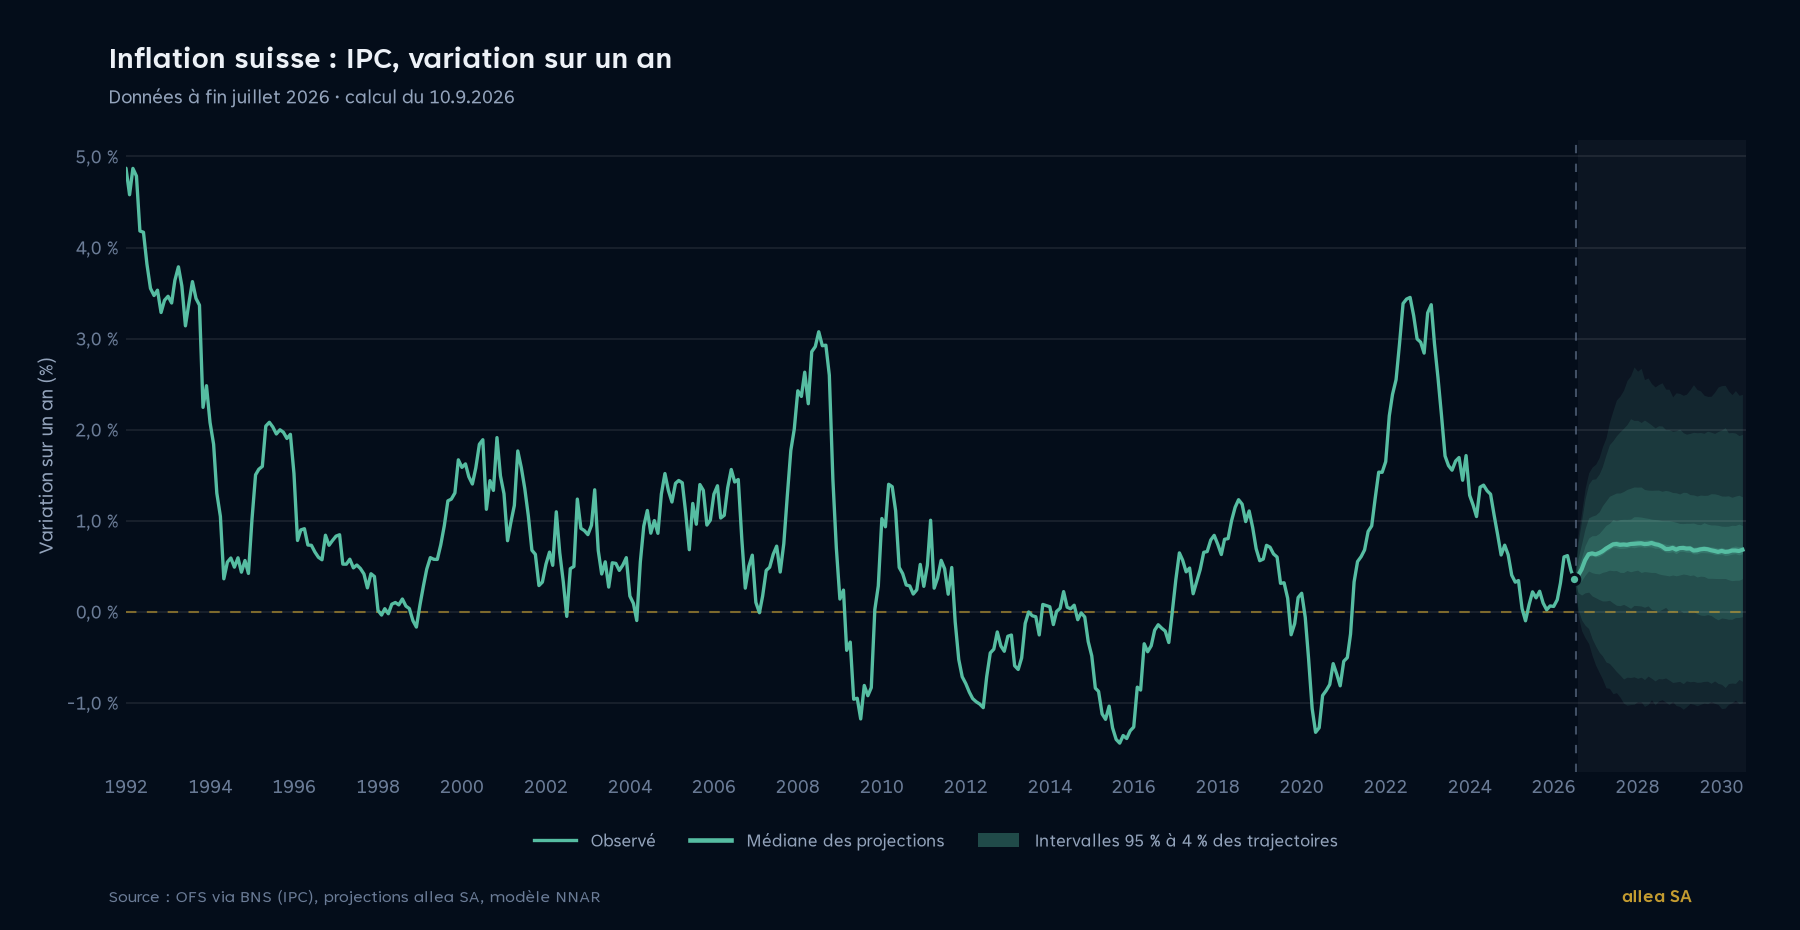
Swiss consumer price index (FSO), change versus the same month of the previous year.
| Horizon | 5% | Median | 95% |
|---|---|---|---|
| Last observed value (July 2026) | – | 0.35 | – |
| end of 2026 | -0.30 | 0.64 | 1.45 |
| end of 2027 | -0.72 | 0.75 | 2.10 |
| end of 2028 | -0.77 | 0.68 | 1.99 |
| end of 2029 | -0.79 | 0.66 | 1.98 |
Method and sources
An NNAR model (neural network autoregression) is a neural network with one hidden layer whose inputs are the past values of the series. It is re-estimated every month on the full available history, then simulated over several thousand paths by adding at each step a random term calibrated on the estimation residuals.
The coloured bands are the quantiles of these paths: the lightest contains 95% of them, the darkest 4% around the median. The further the horizon, the wider the range: this is the direct expression of the model’s uncertainty.
Sources: Swiss National Bank (parameters of the Swiss Confederation bond yield curve), Federal Statistical Office (consumer price index), SKPE (technical guideline 4 and annual press releases). Calculations: allea Ltd.
What is FRP 4?
Technical guideline 4 of the Swiss Chamber of Pension Actuaries governs the recommendation of the technical interest rate by the pension fund expert. It defines an upper limit that the recommended technical interest rate must not exceed without justification.
Why a range rather than a single value?
A single value would hide the uncertainty. The range shows the spread of paths consistent with the history; its width is as informative as its median.
How often are the projections updated?
Every month, as soon as the SNB has published the previous month’s data. The computation date is shown at the top of the page; earlier results remain available in the archive below.
These projections are statistical scenarios produced by a model. They are neither a forecast by allea, nor a recommendation, nor a guarantee: actual future values may differ materially. allea Ltd accepts no liability for their use.
Downloads
Monthly quantiles (CSV) and charts (PNG, dark and light themes) of the latest computation. Earlier computations are kept in the archive.
- nnar-y10-light.png146 KB
- nnar-y10-dark.png138 KB
- nnar-frp4-light.png89 KB
- nnar-frp4-dark.png86 KB
- nnar-cpi_yoy-light.png149 KB
- nnar-cpi_yoy-dark.png145 KB
Archive
- Computation of September 2026nnar-quantiles-2026-09.csv nnar-quantiles-latest.csv nnar.json nnar-cpi_yoy-dark-de.pdf nnar-cpi_yoy-dark-en.pdf nnar-cpi_yoy-dark-fr.pdf nnar-cpi_yoy-light-de.pdf nnar-cpi_yoy-light-en.pdf nnar-cpi_yoy-light-fr.pdf nnar-frp4-dark-de.pdf nnar-frp4-dark-en.pdf nnar-frp4-dark-fr.pdf nnar-frp4-light-de.pdf nnar-frp4-light-en.pdf nnar-frp4-light-fr.pdf nnar-y10-dark-de.pdf nnar-y10-dark-en.pdf nnar-y10-dark-fr.pdf nnar-y10-light-de.pdf nnar-y10-light-en.pdf nnar-y10-light-fr.pdf